
On this page
What “Clicks” Mean for QR Codes
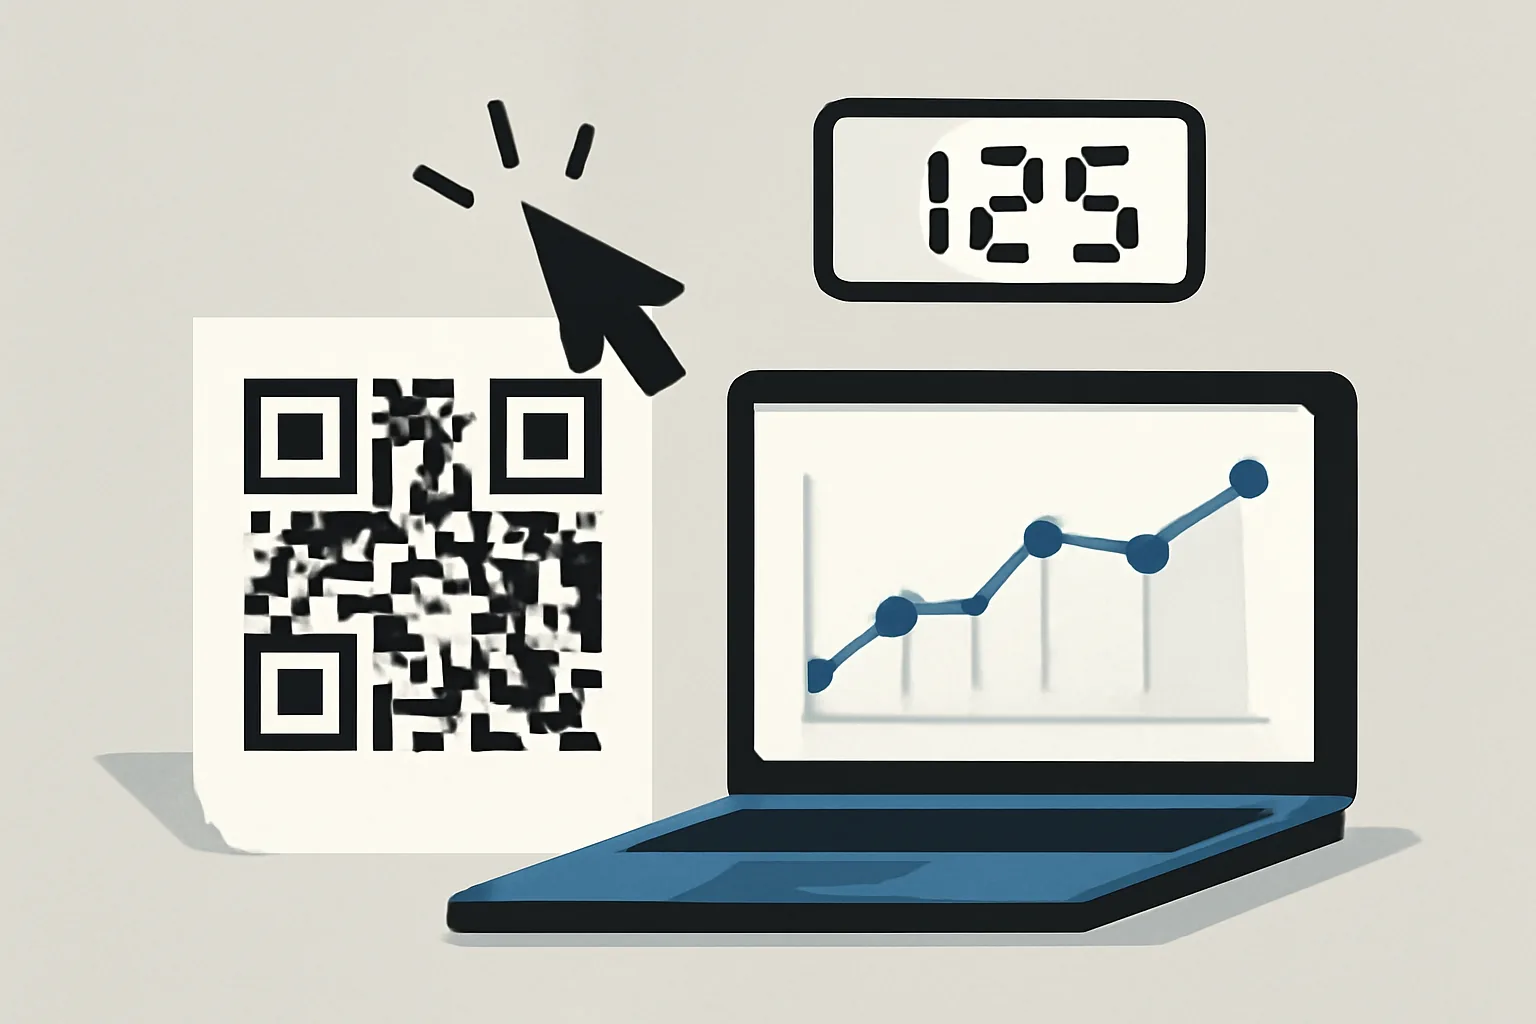
If you are asking how many clicks does my QR code get, the first problem is the word clicks itself. A QR code is usually scanned, not clicked, and that small language shift changes what gets counted.
Some tools count a scan the moment the camera reads the code. Others count only when the scan opens a landing page. A few count a later action, such as a form submit or purchase. That is why two dashboards can show different numbers for the same poster.
A store flyer with 1 QR code may produce 40 scans, 32 visits, and 3 purchases. Those are three different numbers, not one. The scan happened in the real world; the visit happened on the phone; the purchase happened after the click.
Words matter here. If your QR code opens a web page through a tracked link, the platform may call it a click. If it only logs the camera scan, it may call it a scan. If you added a coupon code, the sale becomes the final count, and that is a different layer again.
Can a QR Code Track Clicks?
Yes, but not every QR code can do it. A static QR code contains a fixed destination, so it usually cannot report scan activity after it is printed. A dynamic QR code points through a redirect, which means the destination can be tracked and sometimes changed later.
That redirect is the key. When someone scans the code, the request passes through a tracking layer before reaching the final page. That extra step can record time, device type, and source, which is enough for basic QR code analytics. If you need a broader setup, our guide on dynamic QR codes explains why they are the better choice for campaigns that may change mid-run.
Static QR codes are still fine for a business card or a permanent sign. They are not fine for a three-month campaign where you want to compare week 1 and week 6. Once a static code is printed, the data trail is thin.
One practical detail: a redirect can be counted as a click even if the final page never loads fully. That means your click count may be higher than your time-on-page data. It happens more often than people expect.
Where to Find QR Code Click Data
The first place to check is the QR platform dashboard. Most QR tools show scan totals, dates, and sometimes device breakdowns. If the code was built with a dynamic link, that dashboard may also show the location of the scan.
Next, check web analytics. A QR code usually sends traffic to a landing page, and that page can be tagged in Google Analytics or another analytics suite. A campaign with 4 printed posters and 1 landing page is easy to isolate if the URL is unique.
Link tracking tools are the third source. If your QR code points to a tracked short link, the link platform may show clicks, referrers, and timing. This is where a service like urlik.xyz can help you keep the QR code, the short link, and the campaign data in one place.
Some teams also check server logs. That sounds old-fashioned, and it is, but logs can reveal requests that never made it into browser analytics because scripts were blocked. A log line is not glamorous. It is still useful.
If you are running multiple flyers in 3 neighborhoods, use separate URLs for each one. One dashboard line for all 3 will not tell you which poster worked.
How to Measure a QR Code Accurately
Start with one trackable destination for each campaign. If every poster, package insert, and table tent sends people to the same page, you lose the ability to compare them later. A unique URL for each placement solves that problem in step 1.
Use dynamic QR codes whenever the campaign needs reporting. Print the code once, then point it to a tracked link that can be measured in the dashboard. That way the printed code stays useful after the first week, even if the landing page changes.
Add a clean naming system. For example, use one code for “expo hall A,” one for “window sticker,” and one for “receipt footer.” Three names are enough to keep the data readable without turning the spreadsheet into a mess.
Check results on the same schedule. Weekly works for a normal campaign. Daily works for a short promotion. Random checks are how numbers get misread.
Track the full path, not just the scan. If 120 scans lead to 90 visits and 7 form fills, the QR code is not failing at the first step. It is leaking later in the funnel, and that matters more than the raw click count.
If you also test different landing pages, read our guide to A/B testing links. A QR code is only as good as the page it sends people to.
What Affects QR Code Click Counts
Placement changes everything. A code at eye level near the checkout line will usually beat a code placed low on a dark wall. The same code, 2 different spots, 2 different outcomes.
Design matters too. A code that is too small, too busy, or too close to other graphics can fail before anyone tries. Strong contrast and enough white space make the code easier to scan, especially on older phones.
Audience behavior is another factor. A restaurant customer waiting 8 minutes is more likely to scan than a commuter walking past a sign in 8 seconds. Time changes intent.
Device behavior matters as well. Some phones open the camera app faster than others, and some users need a second attempt before the code registers. That tiny delay can erase a scan if the person is already moving.
Call-to-action text helps because many people do not scan unless they know what they get. “Scan for menu” works better than a vague circle that says only “scan here.” The promise has to be specific enough to earn the tap.
Even the physical size of the code changes the result. A code on a trade show banner must be large enough for people 10 feet away to read it, while a code on a product box can be smaller. One size does not fit both.
Why Your Click Count May Look Different Across Tools
Different tools count different events. One platform may count every redirect request, while another counts only a completed browser load. Those rules are not interchangeable, and the mismatch can look alarming when it is really just a measurement difference.
Redirect chains can add more confusion. If a QR code sends a person to a short link and then to a final page, one tool may count 2 hops while another counts 1 visit. That is normal, not a bug.
Privacy filters can block tracking scripts. A user on strict browser settings may still reach the page, but analytics may never see the visit. The QR code worked, but the data trail broke.
Bot traffic also distorts numbers. Automated scanners can hit a link and inflate the count by 5, 20, or more requests, depending on the source. This is one reason to compare clicks with engagement, not with clicks alone.
Then there is the question of time zones. A scan at 11:55 p.m. and another at 12:05 a.m. may fall into different days, different reports, and different summaries. The code did not change. The clock did.
If you need to compare redirect behavior, the article on 301 vs 302 redirects is worth a read because redirect type can change what gets cached and what gets counted.
How to Improve QR Code Performance
Write a better call to action. “Scan to see the price list” is clearer than “Scan me.” A specific promise gets more scans because people know the payoff before they lift the phone.
Put the QR code where the phone naturally pauses. Table cards, receipts, invoices, product packaging, and checkout counters work better than moving vehicles or tall signs seen from across a street. A stationary moment is your friend.
Use stronger contrast. Black on white is still the simplest option, and a clean border helps. A decorative background may look nice in a design mockup, but the scan has to work in the real world.
Keep the landing page mobile-friendly. If the page loads slowly or asks for tiny taps, you lose people after the scan. A QR code is not the finish line; it is the doorway.
Match the code to the audience. A campus event may use one message, while a retail box needs another. A single QR code can be reused, but the message around it should fit the setting.
If you are also tracking brand trust or campaign identity, a custom short link domain can make the destination look more credible on printed material, especially when the code sits beside a logo and a short message.
One more point: test the code with at least 3 phones before printing 500 copies. A code that works on one device and fails on another is an expensive mistake.
When to Use a QR Code Analytics Tool
A basic link tracker is enough for a small campaign with 1 poster and 1 goal. If you only need to know whether the code was scanned this month, a simple dashboard may be all you need.
Use a dedicated QR code analytics tool when the campaign has multiple placements, dates, or teams. If marketing wants to compare 6 store windows and operations wants a single report, a specialized tool saves time and arguments.
You should also choose a dedicated tool if the QR code changes often. Product launches, events, and seasonal campaigns rarely stay the same for long. A dynamic setup keeps the printed code alive while the destination changes behind it.
Advanced tools help when you need segments. For example, a code on packaging may get 80 scans from one country and 12 from another, and those two groups may need different pages. That is a stronger use case than raw totals alone.
Some teams pair QR code analytics with other tracking features. If a campaign needs audience retargeting after the scan, the article on retargeting pixels on short links explains how the scan can become part of a larger follow-up plan.
For sensitive offers, security matters too. If a QR code leads to a private page, Password-Protected links can keep casual visitors out without changing the printed code every time the offer changes.
The real decision is simple: if one number is enough, a basic tracker works. If you need placement-level data, device breakdowns, and a way to answer “which poster paid for itself,” then a QR code analytics tool is the better answer.
Put this into practice
Paste a link and get a short URL, a QR code and click stats in seconds — free, no sign-up.
More from the blog
How Much Does QR Code Tracking Cost at Scale?
Learn how much does QR code tracking cost at scale, including scan volume, code counts, analytics depth, retention, and hidden ops fees.
How to Migrate QR Codes to a New Destination Without Reprinting
Learn how to migrate QR codes to a new destination without reprinting by checking editability, ownership, redirects, and analytics continuity.

How to Track QR Code Scans on Printed Marketing Materials
Learn how to track QR code scans on printed marketing materials with unique codes, trackable links, testing, and clear reporting.